Getting Started with Livebook
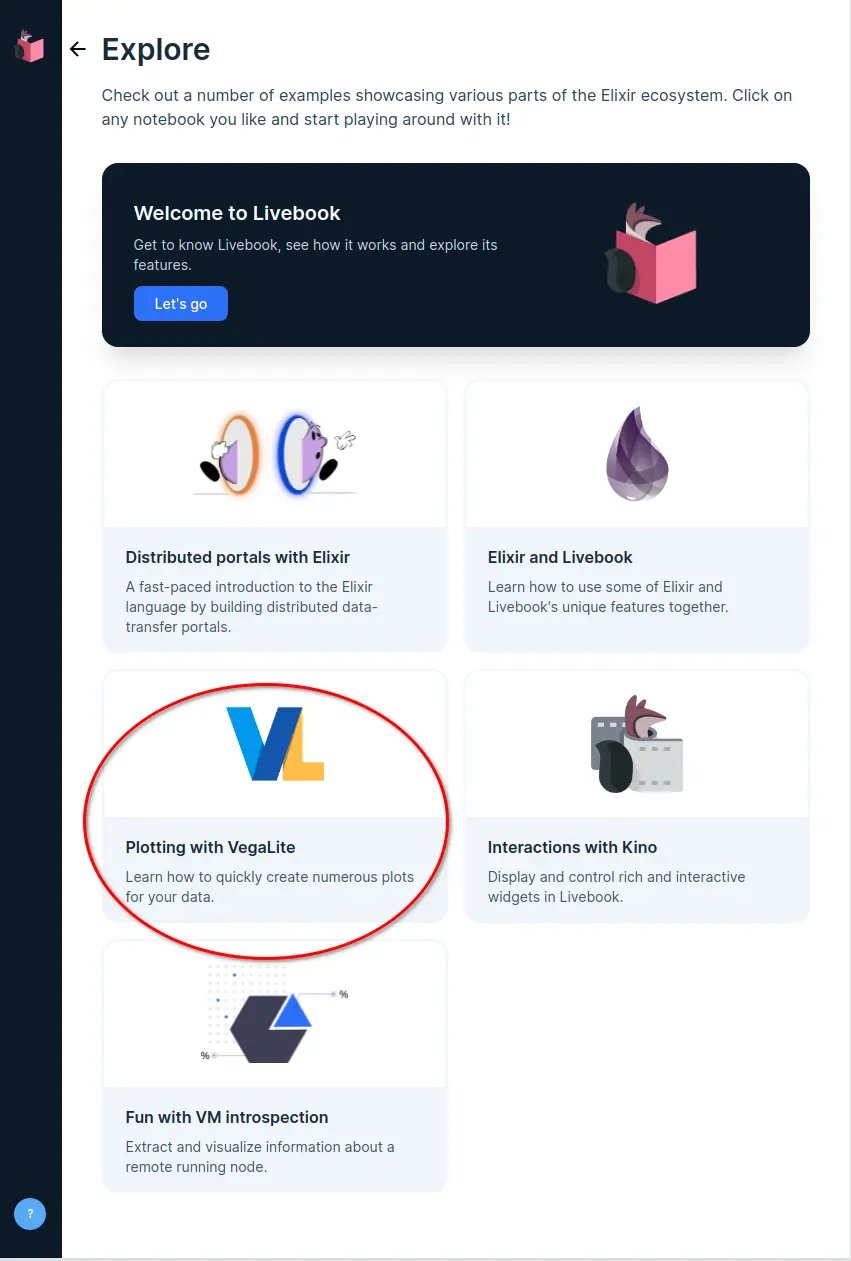
Once you have Livebook running locally, visit the “Learn” section for examples of things you can do. Also, check out the Livebook News to find interesting developments and to spark new ideas. Here are a few ideas of things you can do when Livebook is connected to your server.- Query your users grouping by an interesting attribute and graph it.
- Chart user sign-ups over time.
- Analyze customer orders in a table.
- Create scripts in the form of notebooks to run common administrative commands.
Business Intelligence Through Livebook
Let’s walk through using Livebook to get Business Intelligence (BI) data from your Elixir app.Visualization Setup
With Livebook v0.2, support was added for visualizations through the Elixir packages VegaLite and Kino. In this example, we’re connecting a locally running Livebook to our app running on Fly. In order for the visualization tools to work, these libraries need to be installed on our server. You may have seen Livebook examples showing how we canMix.install the needed graphics libraries. That doesn’t work when you are attaching to a remote mix project. It’s actually a good thing that we can’t just Mix.install like that on a remote project. You wouldn’t want anyone with access to attach to your live system and install random packages!
That just means we need to install the dependencies first. Add the vega_lite and kino libraries to your project’s mix.exs file and deploy your app.
Starting Your Analysis Notebook
While you are figuring out what you want to examine in your app, you can explore it locally on your dev machine. Once you start, you may find you want to update your project code. Also, while playing locally, you reduce the chance of a badly structured query negatively impacting your live system. I like starting Livebook using the EScript method. Once installed, in a terminal you just go to the directory where your project’s source code lives and start Livebook from there.Create a Notebook
Open Livebook in a browser and create a “New notebook”. For the first notebook, let’s keep it really generic because I don’t know what makes sense for your project. Name the notebook something like “Exploring Data”. Create a section for “Setup” and one for “Analysis”. Save the notebook with your project. I suggest creating a “notebook” folder to hold them so they can be checked in with your project and shared with the team.Connect to Your Project
At this point, we haven’t connected Livebook to our project so we can’t access the project’s code yet. To do this, start the project with something similar to the following command: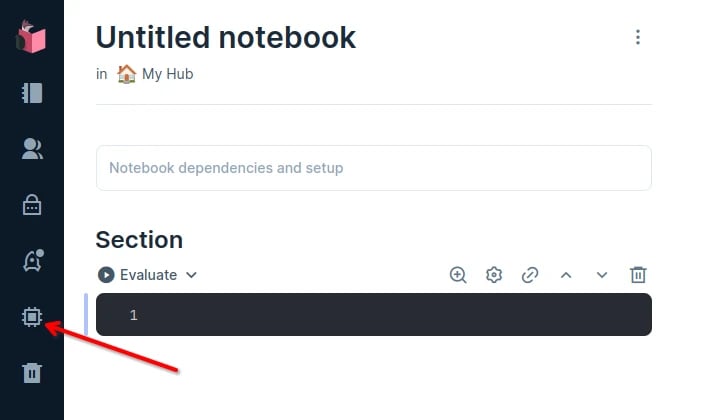
Your First Analysis
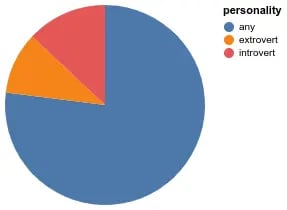
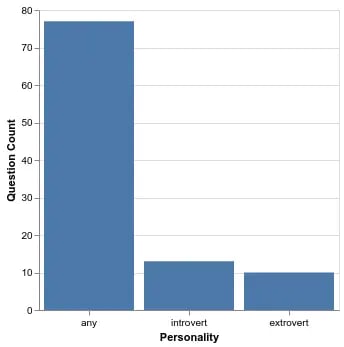
This is where everything gets specific to the project. I’ll walk through an example so we can see how to pull data, aggregate it, and visualize it. Then we’ll turn you loose on your project! My project contains survey-style questions. Some questions use a “personality” type field. My first goal is just to get the data and some counts to see how it’s distributed. Under Setup, I add an Elixir cell and the following code:Vl is the VegaLite alias. Here’s the result:
Getting Started with VegaLite
If the VegaLite code looks scary, don’t worry! I’m actually a total VegaLite noob! Livebook includes some built-in notebooks you should check out for code examples on how to structure data and configure VegaLite for the visualization you want.